Consistency Checker

Leveraging machine learning for flagging data anomalies, streamlining review by automatically highlighting inconsistencies across large datasets.

Project Overview

The Consistency Checker is a critical tool within the for:sight platform that uses machine learning to detect potential data anomalies. By referencing historical quarterly and yearly data uploads, it intelligently flags specific cells across large datasets for review. This eliminates the need for users to manually sift through thousands of rows, allowing them to quickly identify and address potential issues.For each flagged item, the tool provides an analysis explaining why the system suspects a discrepancy. Users can then choose to:

  • Keep the original data
  • Replace it with the expected result suggested by the system
  • Or add notes and approve the row for submission

This process continues until all data rows are reviewed and resolved.

Research Objectives

To ensure the redesigned Consistency Checker aligned with user needs, the research phase focused on understanding:

  • How users interact with flagged data and validation tools
  • Pain points with the existing Fix & Verify interface
  • Desired improvements for reviewing and approving flagged data
  • Expectations around usability, clarity, and efficiency in large dataset review

Key Insights

  • Overwhelming Interface
    Users found the original UI dense and difficult to scan, especially with nested content and large headers.
    who run campaigns aligned to thematic streams within an event
  • Lack of Clarity Around Flags
    Many users struggled to understand why certain cells were flagged or what the expected correction was.
  • Frequent Scrolling
    Due to large row heights and deep layouts, users had to scroll excessively, impacting workflow speed.
  • High Mental Load
    Users had to manually compare flagged data with expected results and prior knowledge with limited visual assistance.
  • Desire for Batch Actions
    Users often wanted to approve or edit similar rows in bulk rather than one at a time.
  • Need for In-Row Analysis
    Users expressed a strong need to view analysis inline without losing the table’s context or increasing visual clutter

How Research Informed Design Decisions

  • Confusing Flagged Logic
    Added inline expandable panels with machine-generated analysis.
  • Table Rows Too Deep
    Reduced row height and header size; added density toggle.
  • No Bulk Actions
    Introduced multi-row select and batch edit/approve.
  • Poor Scanability
    Improved use of colour, icons, and visual cues to quickly distinguish flagged vs. approved data.
  • Users Unsure On What To Do Next
    Implemented clearer step-by-step flow and call-to-action buttons.

Design Goals

The original interface was functional but overly complex. The objective was to redesign the experience to enhance usability without sacrificing core capabilities.

Key Goals

  • Simplify the interface
    Reduce visual clutter in the header and streamline table complexity.
    Provide a cleaner, more approachable UI for both technical and non-technical users.
  • Improve data visibility
    Decrease table depth to display more rows on screen without scrolling.
    Optimise layout for large datasets.
  • Enhance flagged data interaction
    Clearly highlight flagged cells with intuitive visual cues.
    Ensure users can immediately identify which rows require attention.
  • Contextual analysis and actions
    Introduce collapsible analysis panels within each row to display expected results and system reasoning.
    Maintain a compact row height while ensuring clarity of the analysis feature.
  • Introduce new functionality
    Analyse flagged data
    Edit directly within the table
    Approve corrected or verified data
    Add notes for context or documentation
    Adjust row display density
    Select/edit multiple rows for batch updates

Solution

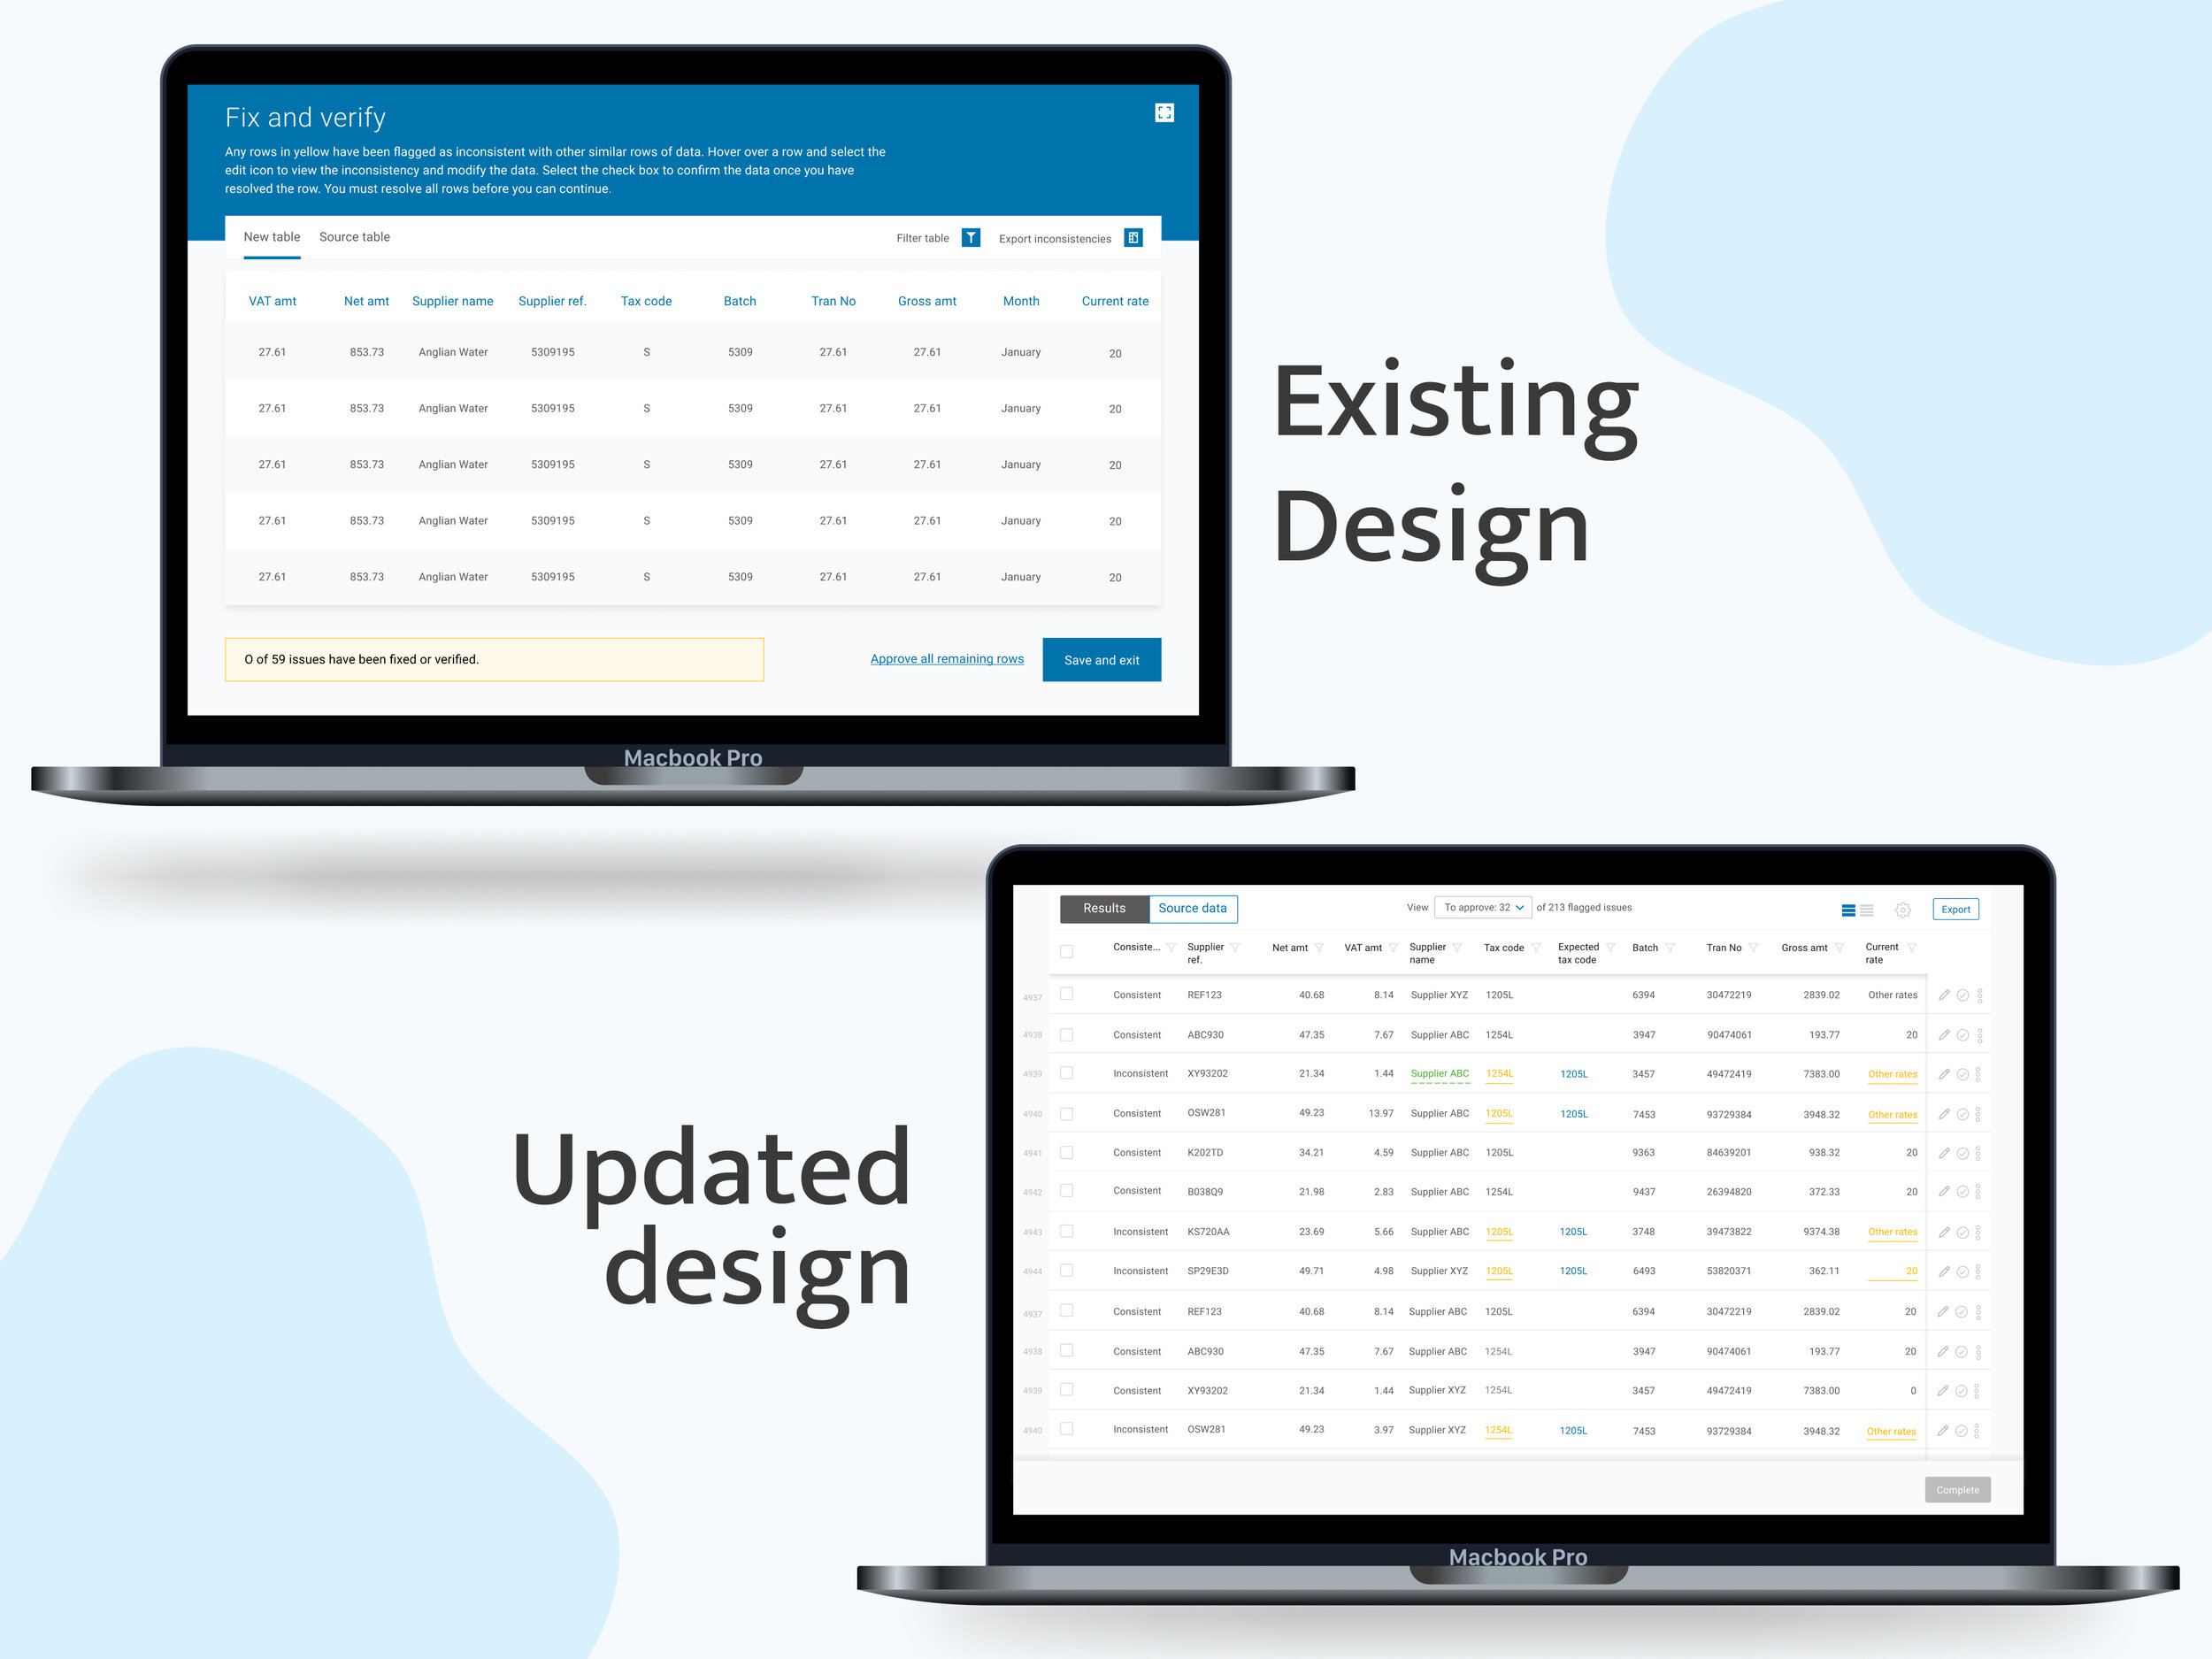
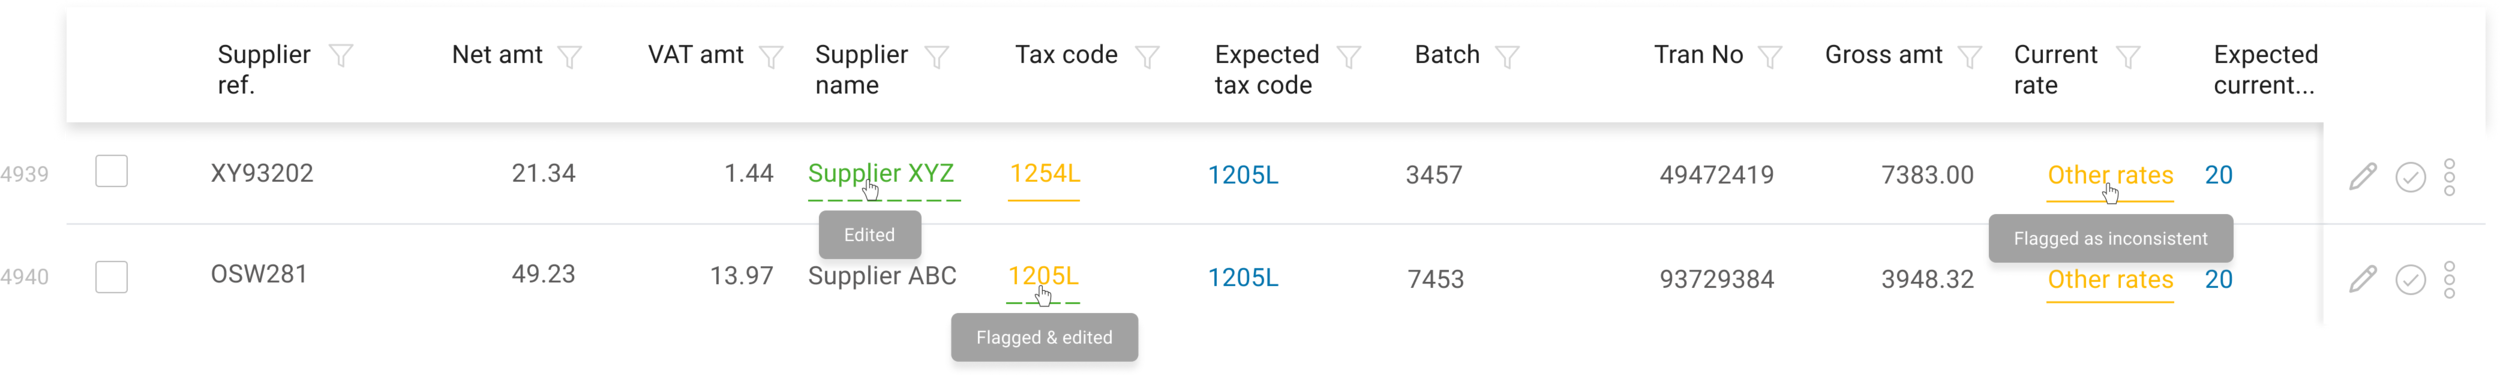
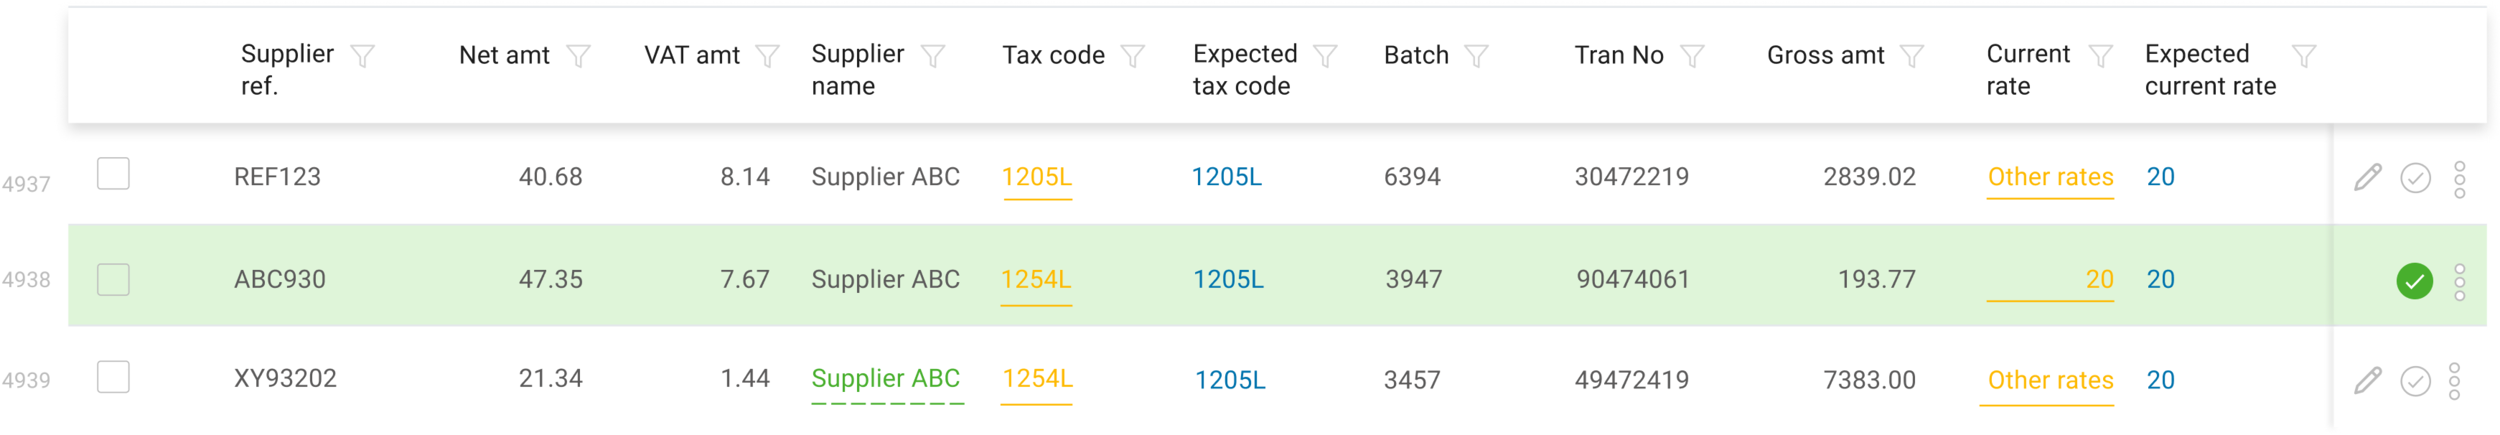
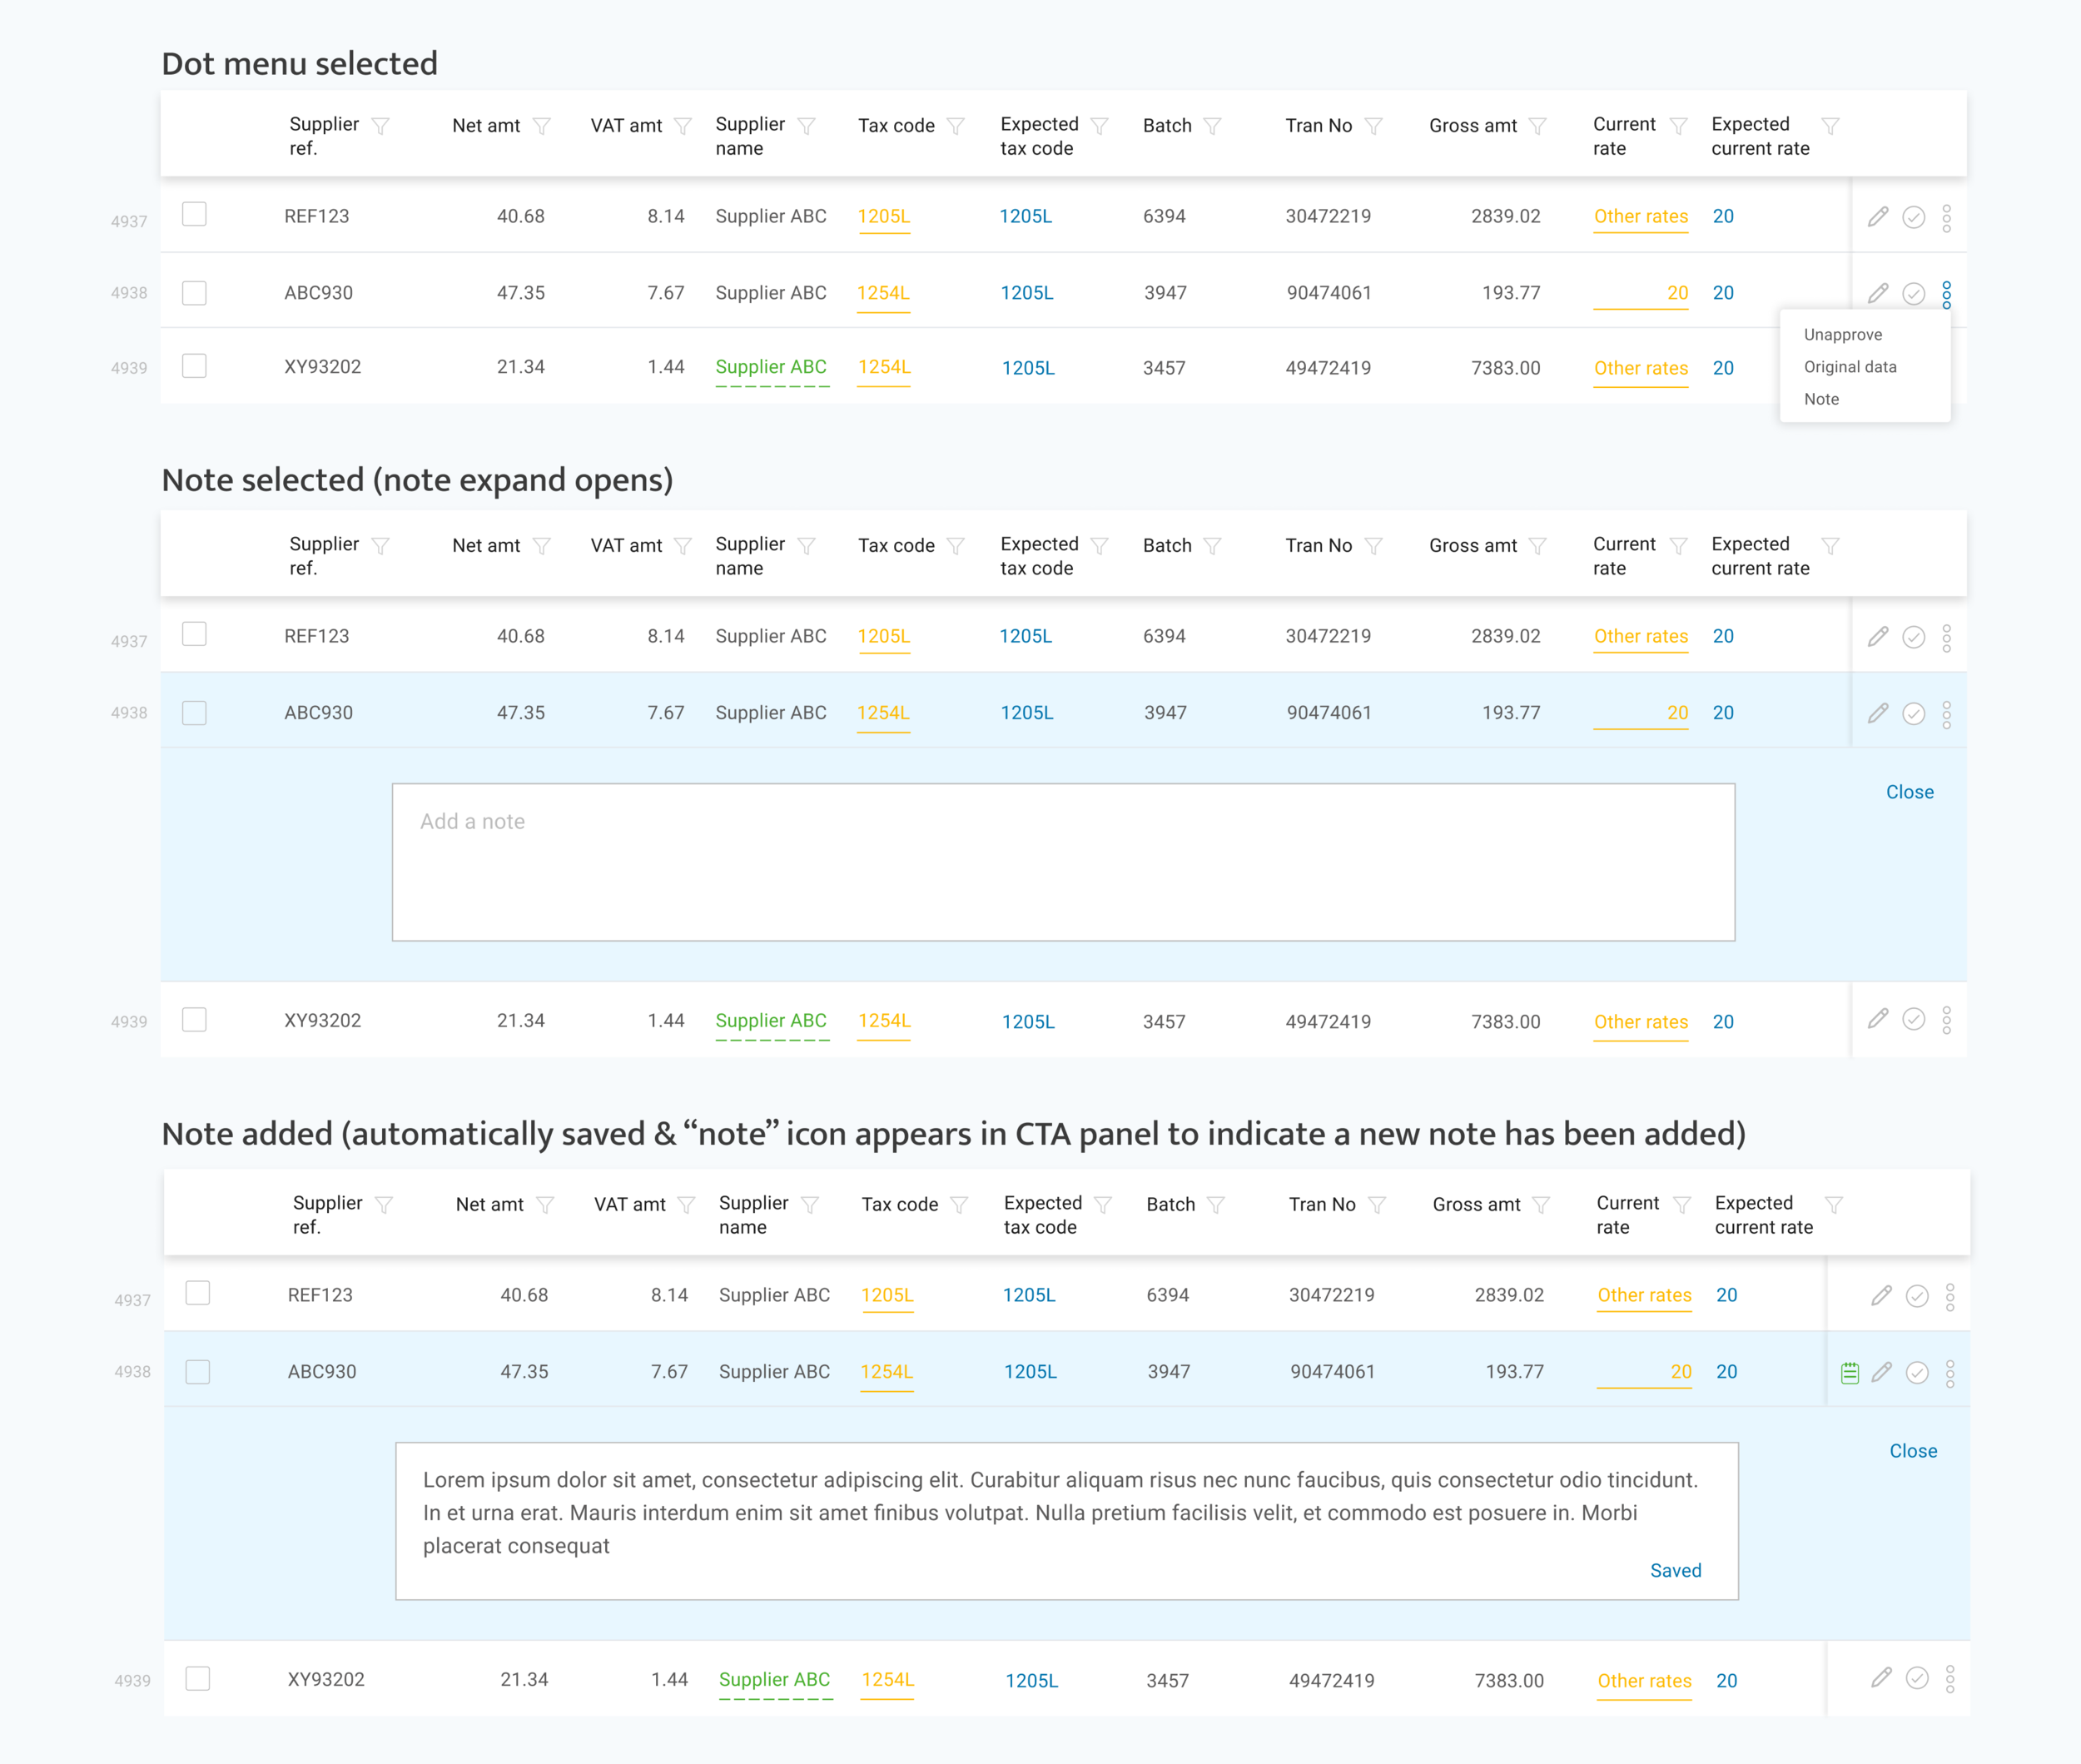
Flagged, edited and flagged & edited cells
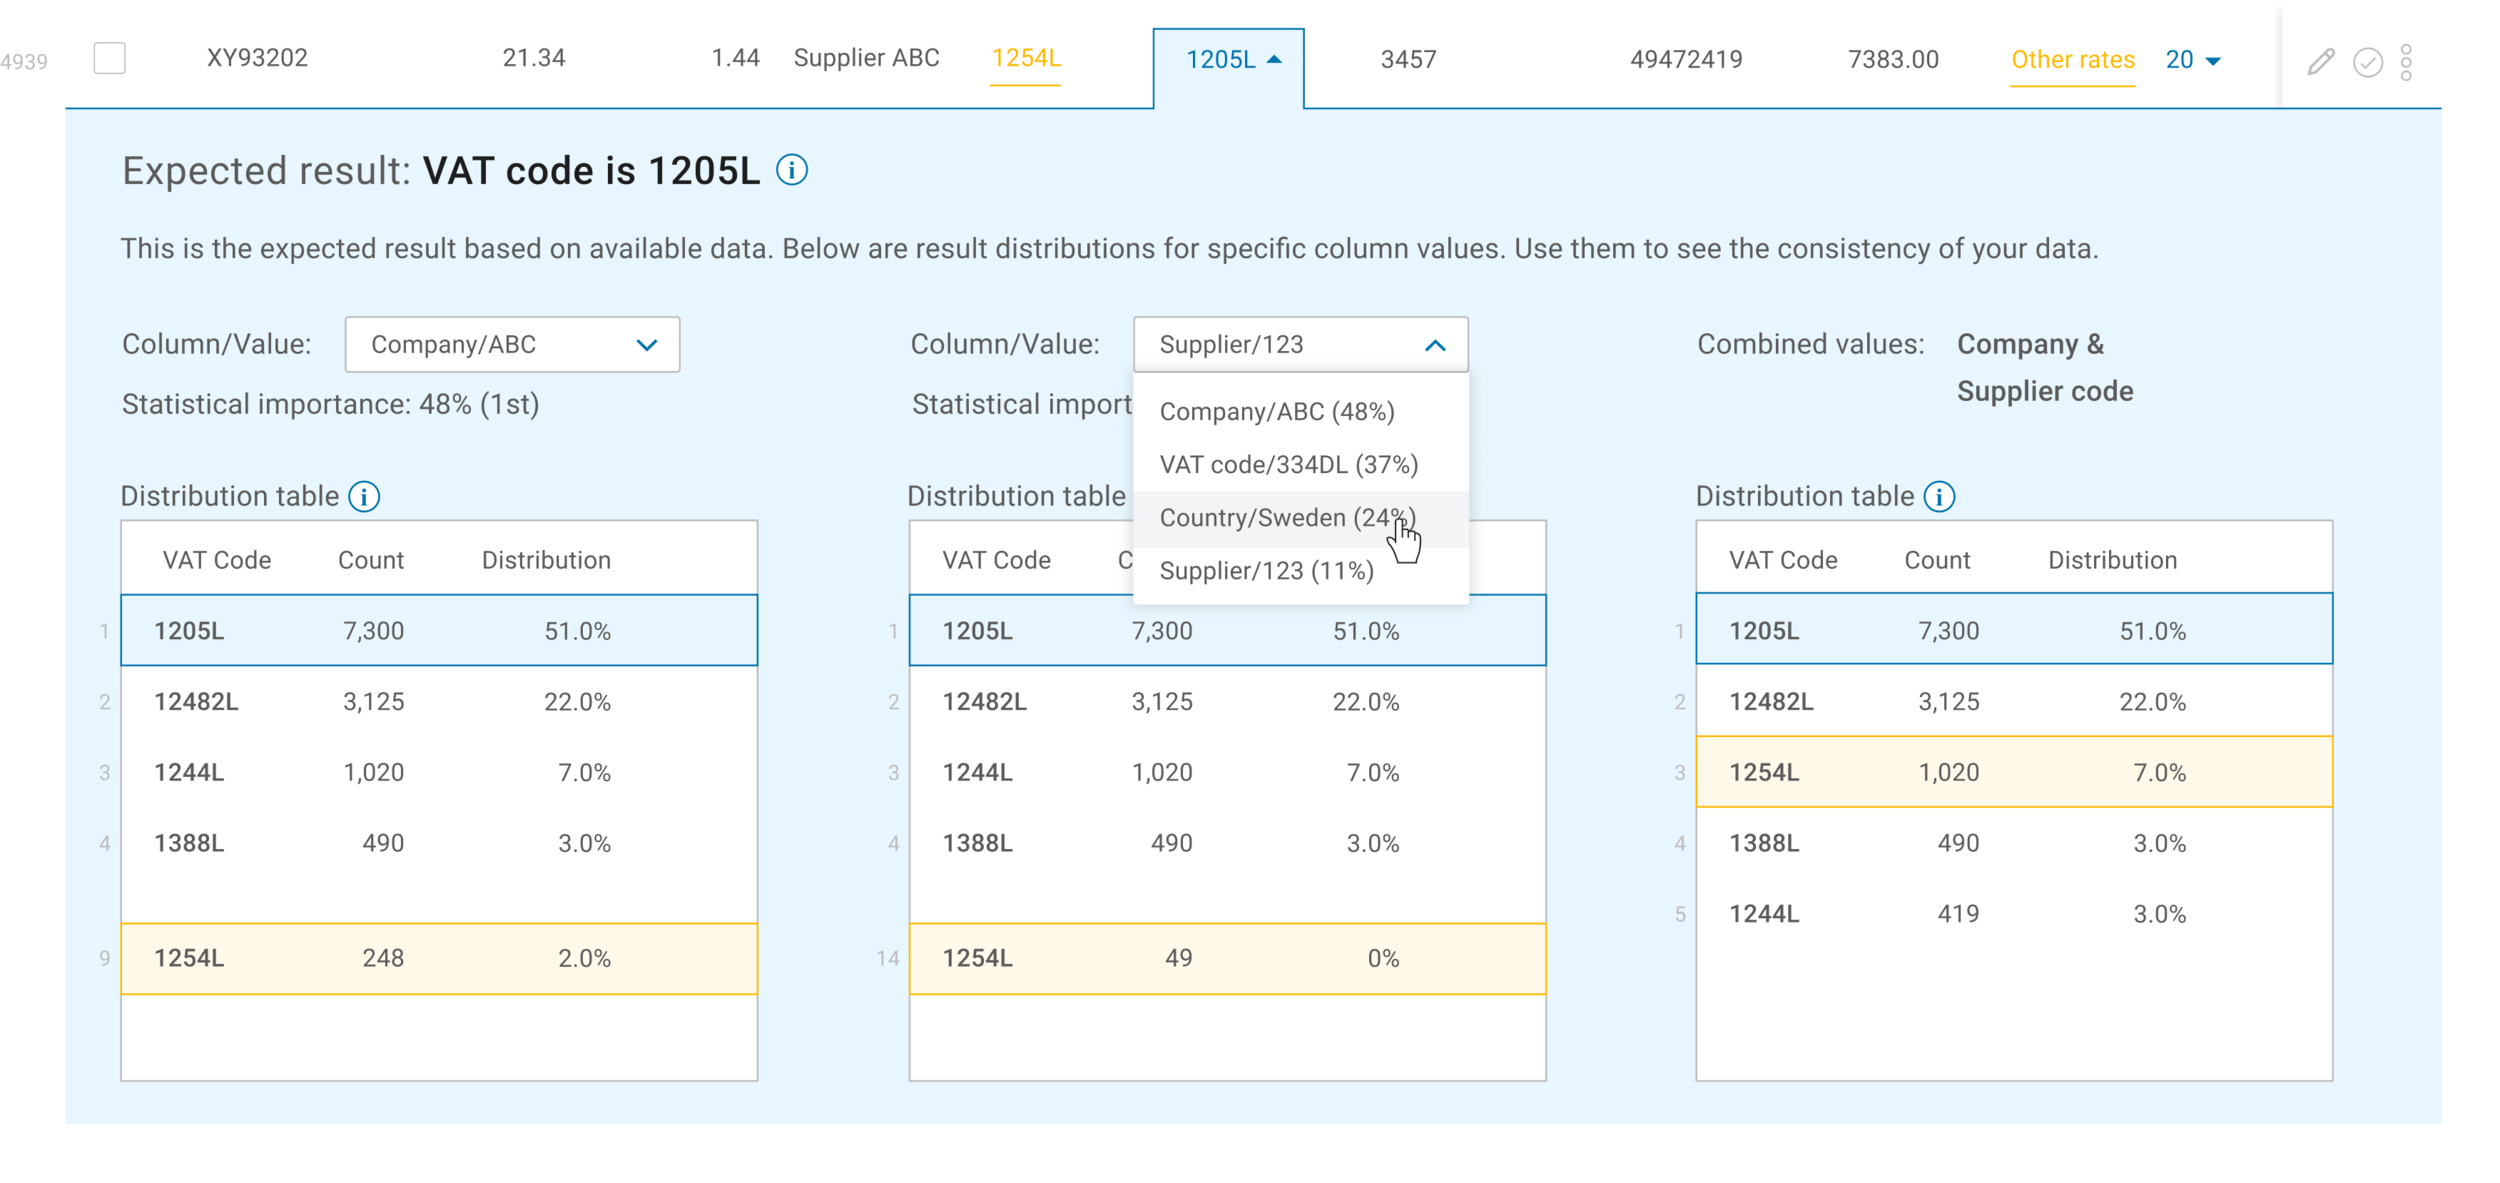
The analysis expand can be opened in any row that has an “expected result”. The purpose of this expand is to explain to the user why the machine learning believes a specific column value is expected to be a different value (this could be based off of previous data uploads).
Row edit
Approved row
Add a note to row
Row display density
Multi-edit

Learnings